Master network analysis with our Wireshark Tutorial and Cheat Sheet.
Find immediate value with this powerful open source tool. When everything is up and running, read through the tips and tricks to understand ways to troubleshoot problems, find security issues, and impress your colleagues.
Even a basic understanding of Wireshark usage and filters can be a time saver when you are troubleshooting network or application layer issues on the wire (or WIFI).
Examples to Understand the Power of Wireshark
Wireshark can be useful for many different tasks, whether you are a network engineer, security professional or system administrator. Here are a few example use cases:
Troubleshooting Network Connectivity
- Visually understand packet loss
- Review TCP retransmission
- Graph high latency packet responses
Examination of Application Layer Sessions (even when encrypted by SSL/TLS see below)
- View full HTTP session, seeing all headers and data for both requests and responses
- View Telnet sessions, see passwords, commands entered and responses
- View SMTP or POP3 traffic, reading emails off the wire
Troubleshoot DHCP issues with packet level data
- Examine DHCP client broadcast
- DHCP offer with address and options
- Client requests for offered address
- Ack of server acknowledging the request
Extract files from HTTP sessions
- Export objects from HTTP such as javascript, images, or even executables.
Extract file from SMB sessions
- Similar to the HTTP export option but able to extract files transferred over SMB, the ever present Microsoft File Sharing protocol.
Detect and Examination of Malware
- Detect anomalous behaviour that could indicate malware
- Search for unusual domains or IP address endpoints
- Use IO graphs to discover regular connections (beacons) to command and control servers
- Filter out the "normal" and find the unusual
- Extract large DNS responses and other oddness which may indicate malware
Examination of Port Scans and Other Vulnerability Scan types
- Understand what network traffic the vulnerability scanner is sending
- Troubleshoot vulnerability checks to understand false positives and false negatives
Installation of Wireshark
Wireshark will run on a variety of operating systems and is not difficult to get up and running. We will touch on Ubuntu Linux, Centos and Windows.
Install on Ubuntu or Debian
~# apt-get update
~# apt-get install wireshark tshark
Getting the latest version of Wireshark has a number of benefits. Many new features are released with major updates such as new protocol parsing and other features. There is a PPA available for Ubuntu, add the repository and update packages to ensure you are getting a more recent release.
~# add-apt-repository ppa:wireshark-dev/stable
~# apt-get update
Install on Fedora or CentOS
~# yum install wireshark-gnome
Install on Windows
Head over to the Wireshark Download page, grab the installation executable and run it to install. Pretty straight forward, you will also be installing a packet capture driver. This allows the network card to enter promiscuous mode.
Getting Started with Filters
After running an initial capture you will see the standard layout and the packet details that can be viewed through the interface.
When you have captured an HTTP session, stop the capture and try playing with a few basic filters and the Analyze | Follow | HTTP Stream options.
The filters are easy to read and self-explanatory. You enter these expressions into the filter bar (or on the command line if using tshark). A primary benefit of the filters is to remove the noise (traffic you don't want to see). As seen here, you can filter on MAC address, IP address, Subnet or protocol. The easiest filter is to type http into the filter bar. The results will now only show HTTP (tcp port 80) traffic.
IP Address Filter Examples
ip.addr == 192.168.0.5
!(ip.addr == 192.168.0.0/24)
Protocol Filter Examples
tcp
udp
tcp.port == 80 || udp.port == 80
http
not arp and not (udp.port == 53)
Try generating a filter combination that shows all non HTTP and HTTPS traffic leaving your local system that is not destined for the local network. This is a good way to find software (malware even) that is communicating with the Internet using unusual protocols.
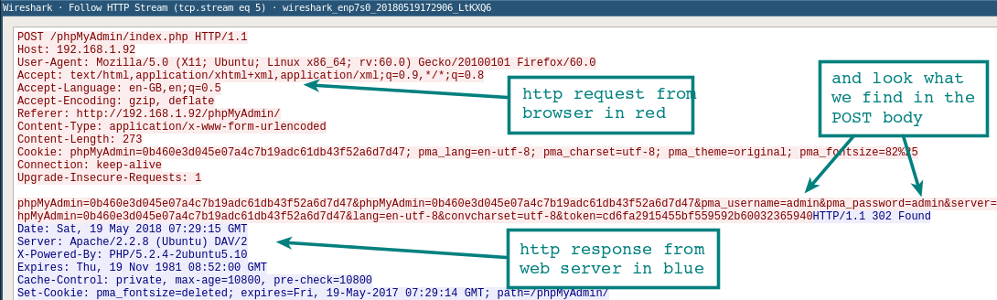
Follow the White Rabbit Stream
Once you have several packets showing HTTP, select one and then select Analyze | Follow | HTTP Stream from the drop-down menu. This will show you an assembled HTTP session. In this new window, you see the HTTP request from the browser and HTTP response from the web server. Goal! You are now winning at Wireshark. Continue reading our Wireshark Tutorial for more advanced tips.
Resolve DNS in Wireshark
By default, Wireshark won't resolve the network address that it is displaying in the console. Only showing IP addresses, by changing an option in the preferences, you can enable the resolution of IP addresses to network names. This will slow down the display of packets, as it also does when using tcpdump, due to the DNS resolution that has to take place. It is important to understand if you are doing a live capture, the DNS requests from your Wireshark host will be additional traffic that you might be capturing.
Edit | Preferences | Name Resolution | Enable Network Name Resolution
Tshark for the Command Line
If you haven't had a play with tshark, take a look at our tshark tutorial and filter examples. This program is often overlooked but is a great way to capture application layer sessions on a remote system. The advantage over tcpdump is you can capture and view application layer sessions on the fly, as the protocol decoders included in Wireshark are also available to tshark.
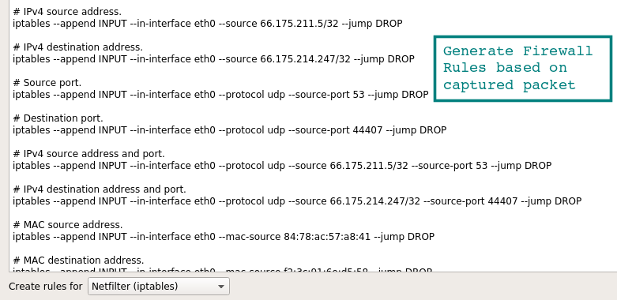
Build Firewall Rules
A quick way to generate command line firewall rules, this can save a few minutes Googling for different firewall syntax. Select a rule, and head up to the Tools | Firewall ACL Rules. Different firewall products such as Cisco IOS (standard and extended), ipfilter, ipfw, iptables, pf and even Windows firewall using netsh.
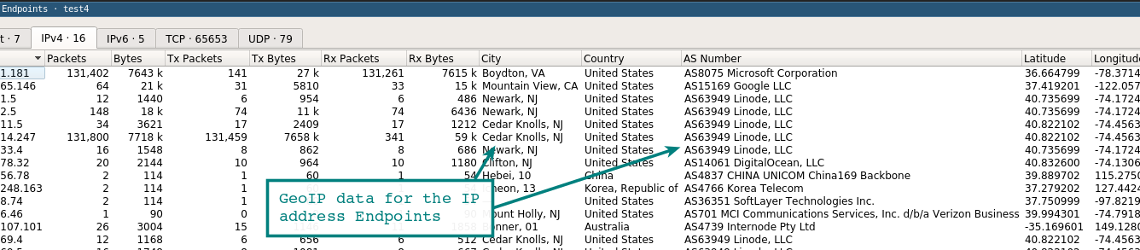
Wireshark GeoIP Mapping
As long as Wireshark has been compiled with GeoIP support and you have the Free Maxmind databases available, you can resolve IP addresses to locations. Look at About | Wireshark to see what has been compiled with the version you are using. If GeoIP is listed, ensure you have the GeoLite City, Country, and ASNum databases in a directory on your system running Wireshark. Point to the location of the databases in Edit | Preferences | Name Resolution.
Test it by loading a capture and selecting Statistics | Endpoints | IPv4. The columns on the right show the location and ASN information for the IP address.
A further function of the GeoIP feature is to filter traffic based on location using the ip.geoip display filter.
For example, use this filter to exclude traffic from an ASN.
ASN 63949 is the Linode block, so the filter now displays only IP traffic not coming from this netblock.
ip and not ip.geoip.asnum == 63949
Of course, you can apply the same filter to city and country based queries. Doing this removes noise from your capture display and allows you to focus on the packets you care about.
Decrypt SSL/TLS sessions
One way of decrypting SSL/TLS sessions is to use the Private Key from the server that is being connected to by the client. Using this key, you can decrypt the session and view the protocol under the SSL/TLS layer. For example, in a browser session you could see the plain text HTTP.
You are not always going to have access to the servers private key. Hence, there is another option for easily viewing the browser SSL/TLS traffic from your local system. If Firefox or Chrome are loaded using a special environment variable, the individual SSL/TLS session symmetric keys will be logged to a file that Wireshark can read. With these keys, Wireshark can show you the session fully decrypted for the win!
1. Configure the Environment Variable
Linux / Mac
export SSLKEYLOGFILE=~/sslkeylogfile.log
Windows
Under advanced system settings, select Environment Variables and add the variable name SSLKEYLOGFILE with the variable value as the path to where you want the file saved.
2. Configure Wireshark
From the drop-down menu select Edit | Preferences | Protocols | SSL | (Pre)-Master-Secret Log Filename -- Browse to the log file you placed in your environment variable.
Start a capturing on your local system.
3. Restart Firefox or Chrome
After browsing to a HTTPS site. The log file should start to increase in size as it logs the symmetric session keys.
Review the Wireshark session previously started. You should see something resembling the image below showing the decrypted sessions. Take note of the decrypted packets in the tab in the bottom pane.
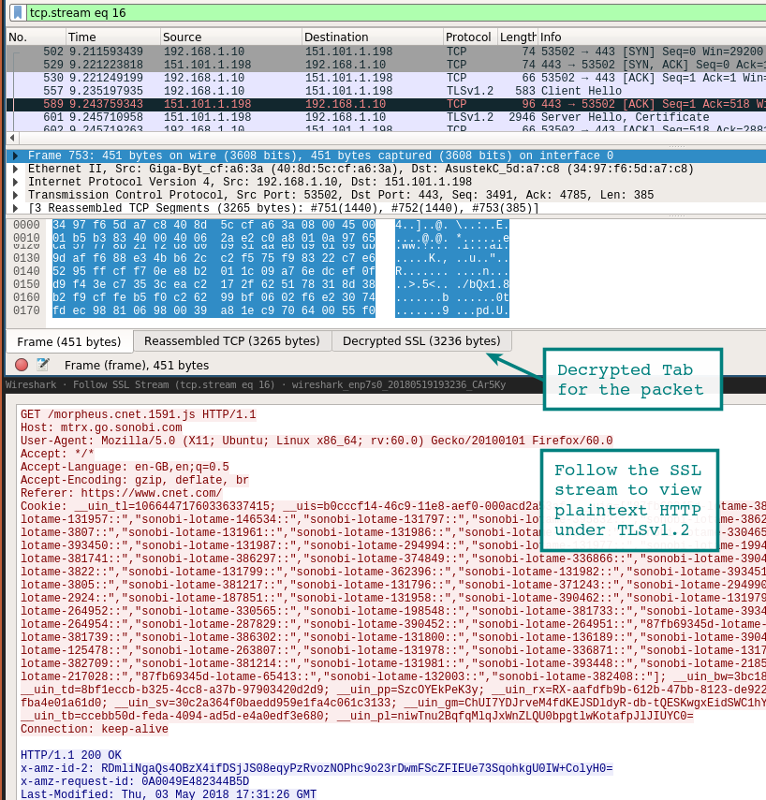
Another way to view the session is to use the analysis drop down and follow the stream. If the session has successfully been decrypted you will see the option for SSL under Stream.
Analysis | Follow | Stream | SSL
Use caution when logging these keys and pcaps. Someone with access to the key log file and your pcap might very well find your passwords and authentication cookies within the pcap.
Another option for getting at the underlying HTTP traffic is using Burp Suite with its CA loaded in your browser. In this case, the proxy decrypts the connection on the client side and then establishes a new SSL/TLS session to the server. There are many ways to man in the middle (mitm) yourself, these are two of the most straightforward.
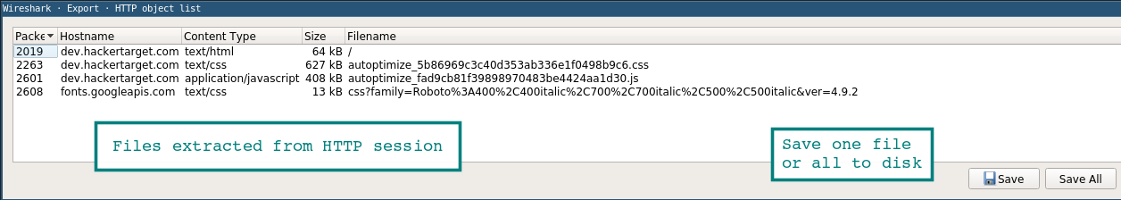
Extract files from PCAP using Export (HTTP or SMB)
It is quite easy to extract files from a Wireshark capture using the export option.
File | Export Objects | HTTP
The new Window will show any files that were found. In this new Window you can save the individual files or save them all to a folder. A similar method can be used to extract files from SMB sessions. This is the Microsoft Server Message Block protocol that allows Windows File Sharing.
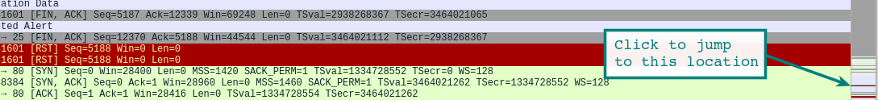
Right Hand Status Bar
Quickly jump to packets based on the color of the main display. For instance, to find Red - Errors see the red line noted in the right hand side status bar and jump to that location with a click.
Sample PCAP's are readily available
You may be getting started with Wireshark and looking for interesting packet captures to explore, the Wireshark Samples page is a great place to start. Due to the fact, there are enough sample protocols to keep you busy for months and several worm / exploit samples for those digging into Network Security Monitoring.
Setting up your Environment
A handy tip is to remember the default console is highly configurable. You may add or remove columns, even adding something as simple as a UTC time column. Which might be immediately useful if you are looking at historical pcaps.
The columns can be configured by going to Edit | Preferences | Appearance | Columns. In this area, you can also change the layout, font, and colors.
This video has good configuration tips for the environment. Including troubleshooting tips and configurations for identifying issues through TCP sequence numbers.
capinfos
A handy command line tool that comes packaged with Wireshark is the capinfos binary. This command will produce a summary of a pcap with statistics, start / finish times and other details.
Run it as below or use the table option -T to produce tab separated output that can be imported into a spreadsheet or parsed on the command line.
test@ubuntu:~$ capinfos test.pcap
File name:           test.pcap
File type:           Wireshark/tcpdump/... - pcap
File encapsulation:  Ethernet
File timestamp precision:  microseconds (6)
Packet size limit:   file hdr: 262144 bytes
Number of packets:   341 k
File size:           449 MB
Data size:           444 MB
Capture duration:    3673.413779 seconds
First packet time:   2018-12-01 11:26:53.521929
Last packet time:    2018-12-01 12:28:06.935708
Data byte rate:      120 kBps
Data bit rate:       967 kbps
Average packet size: 1300.72 bytes
Average packet rate: 93 packets/s
SHA256:              989388128d676c329ccdbdec4ed221ab8ecffad81910a16f473ec2c2f54c5d6e
RIPEMD160:           0742b6bbc79735e57904008d6064cce7eb95abc9
SHA1:                d725b389bea044d6520470c8dab0de1598b01d89
Strict time order:   True
Number of interfaces in file: 1
Conclusion
Wireshark is one of those indispensable tools that many use but few actually master. The rabbit hole goes deep on this one.