
A review into the technology running the worlds leading companies web infrastructure. From the content management system to the hosting infra. Using common Internet Security reconnaissance techniques, we analyze the tech stacks used in the Forbes Global 2000.
This is a follow up to our earlier Fortune 1000 technology report. It is not a one for one comparison, the Forbes Global 2000 is a different set of companies and the detection methods have changed.
Adobe Experience Manager is the leading CMS identified, which makes sense for large companies wanting a corporate backed web content solution. jQuery remains very popular even 20 years on from its first release. A large number serve the pages via CDN or reverse proxies, which makes the origin server location and operating system difficult to identify.
About the Forbes Global 2000
The Forbes Global 2000 is an annual ranking of the largest public companies in the world based on revenue and market value.
Each company's primary website was loaded in an automated Chrome browser and the full page load was recorded. Web Technology fingerprints were then extracted from the captured responses, scripts and headers, and the main page IP address was mapped to a network (ASN) and country using our local ASN lookup data.
Heavy Presence of Bot / Scrape Protections
In the first attempt at collection we used a script running on a VPS. This did not go well as almost 30% of the sites returned bot detection challenges or blocked pages. With the increasing use of AI scrapers and then AI agents using the real browser working in bot management must be a rapidly changing field these days.
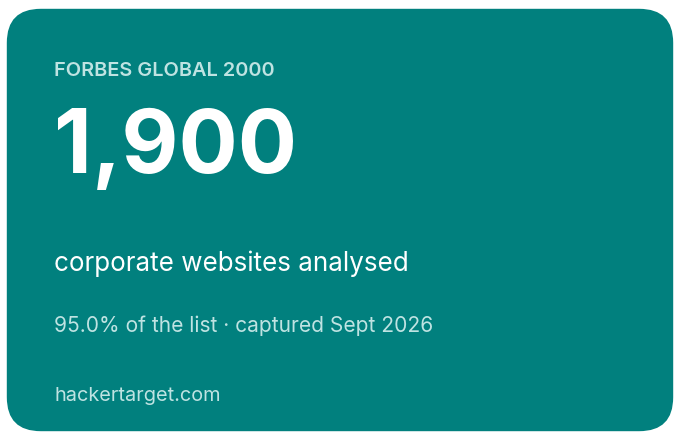
Switching to an automated Chrome browser on a Starlink connection changed the picture completely. A real browser coming from residential style IP space was more successful. The final run used eight isolated browser sessions with a 35 second navigation timeout and a short passive wait for challenges to clear. That approach allowed collection of 1,900 of the 2,000 companies (95%) web sites.
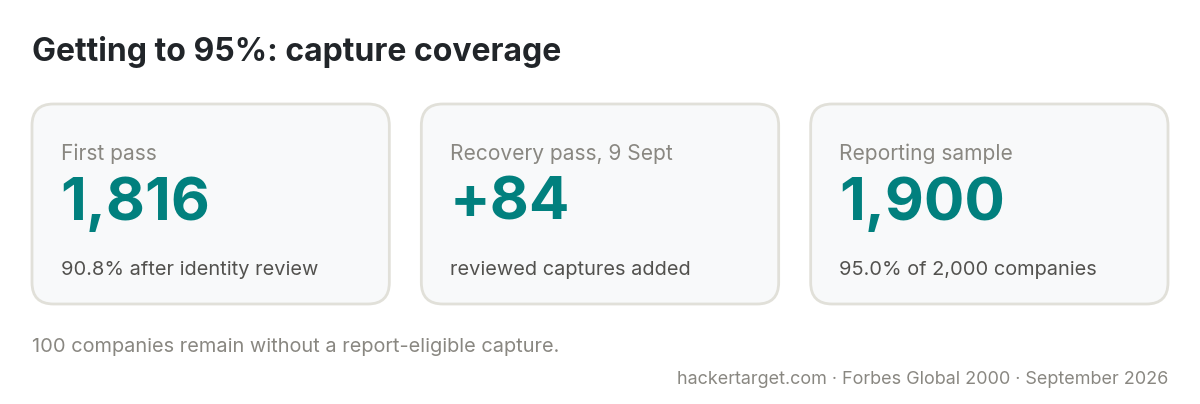
Capture success and valid page content are different tests. Even an HTTP 200 can return a parking page, an application error, or the site of an unrelated organisation. The percentages below are calculated based on the 1,900 captures rather than the full list.
What a Browser Capture Can See
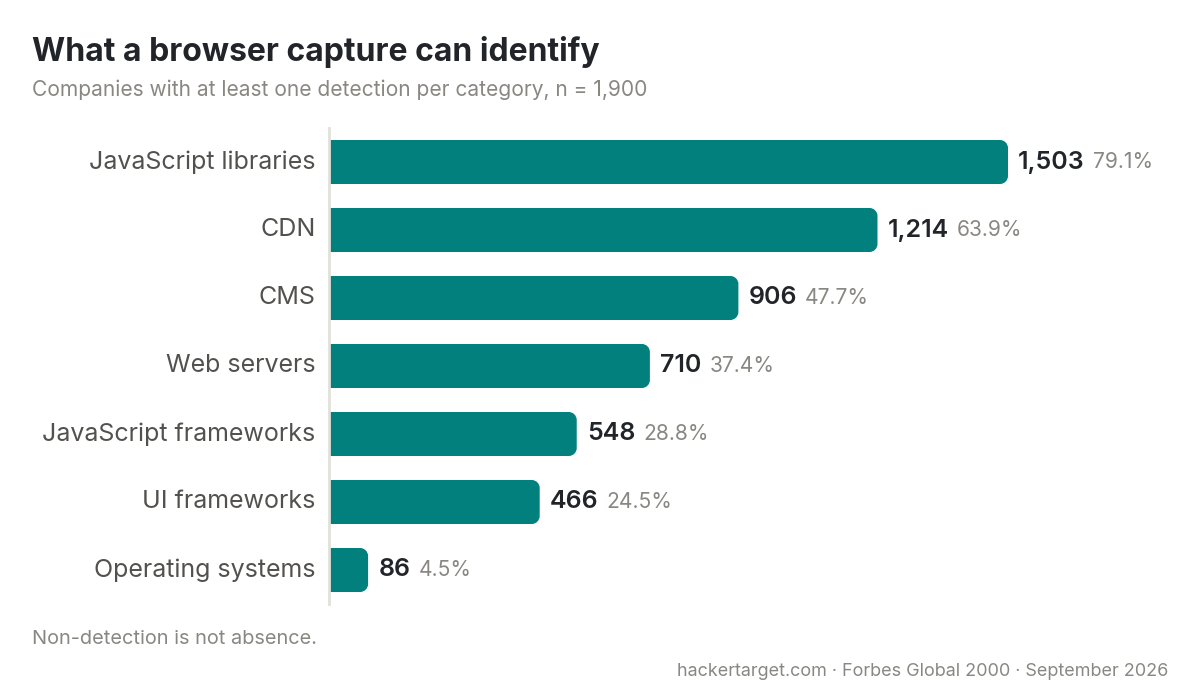
False negatives are very likely, missing detection does not mean the technology is not present, it just means the detection logic did not find it in the page due to differences in deployments. JavaScript libraries and CDNs are easy to spot from the browser. The operating system is difficult. Keep this in mind when reviewing the results.
Web Application and Content Management
A CMS appears in 906 company captures (47.7%). The remaining 994 have no detected CMS. The remaining could be custom applications or captures with incomplete pages.
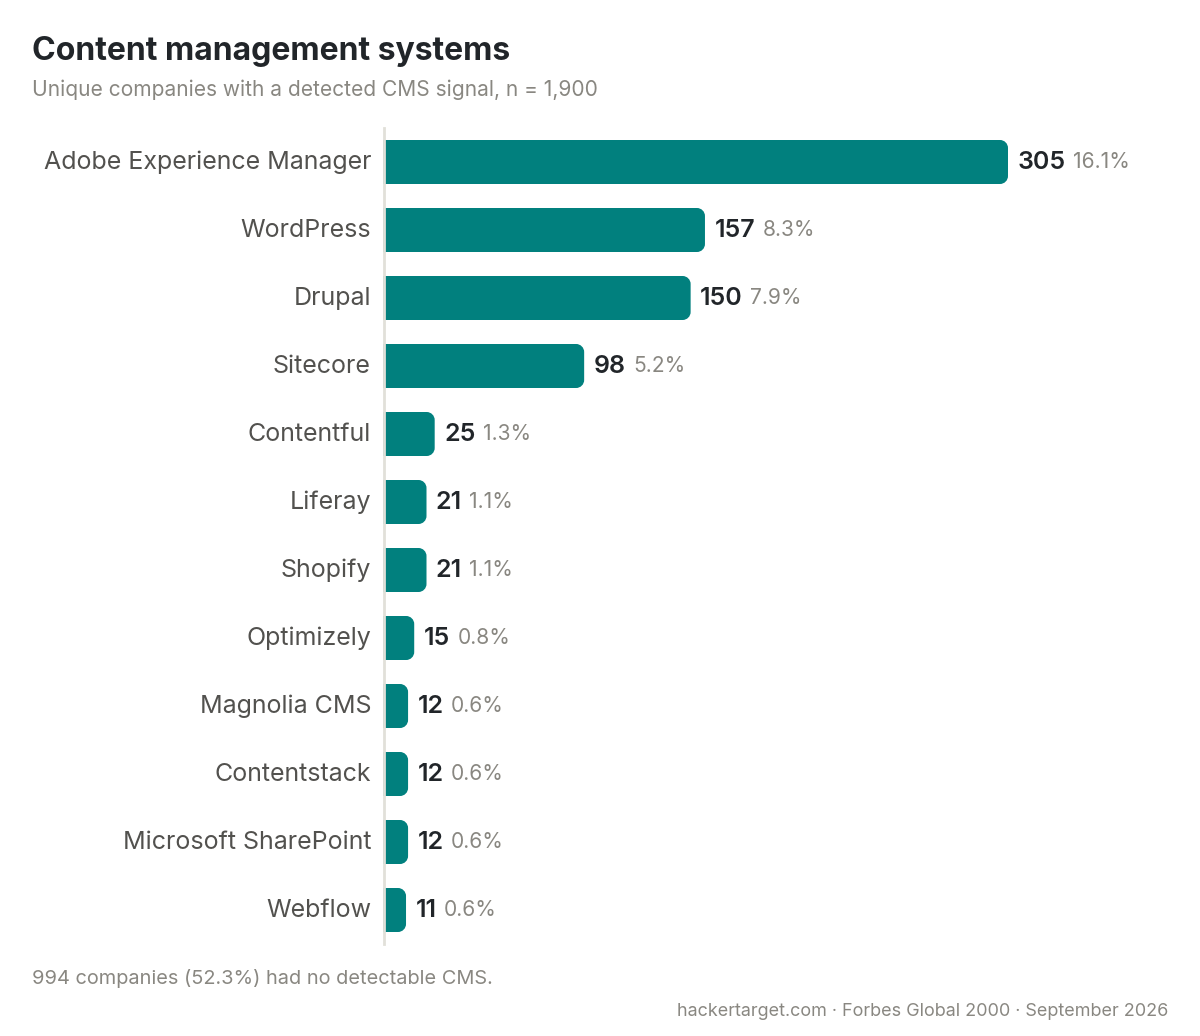
The trend we noticed in the Fortune 1000 has continued. Adobe Experience Manager is now clearly ahead of both WordPress and Drupal among the largest companies in the world, with 305 companies (16.1%). This is relevant to large company technology choices, as opposed to the average web site CMS usage where WordPress clearly leads.
WordPress appears on 157 sites (8.3%) and Drupal on 150 (7.9%). Both are well down on the proportions seen in the US only Fortune 1000 study, and both are a long way below the 40%+ of the web that WordPress powers in larger samples. Sitecore rounds out the enterprise platforms at 98 sites.
WordPress and Drupal Hosting
For Drupal, Acquia Cloud Platform appears in 53 of the 150 Drupal captures (35%) and Pantheon in 17 (11%).
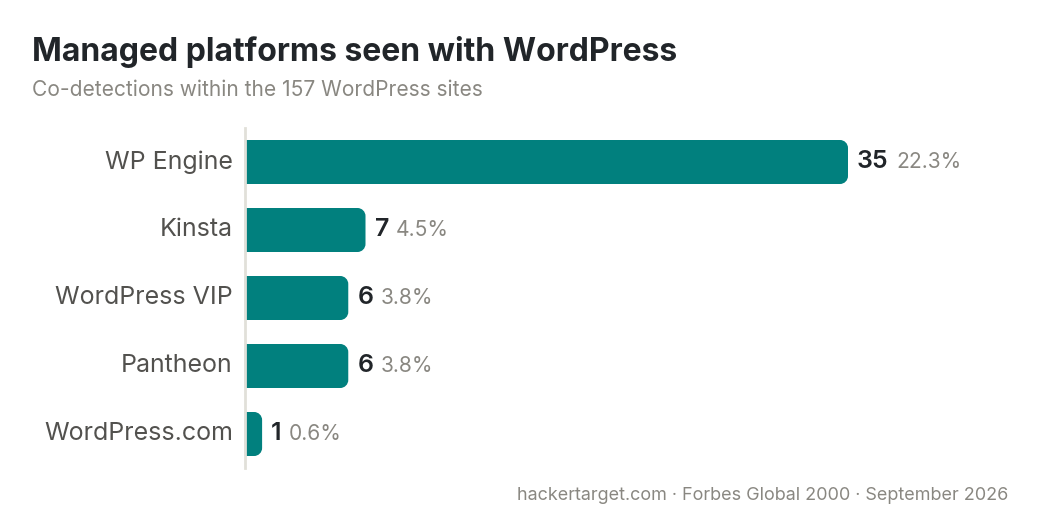
A CDN network is not an origin host, but could be (Linode uses Akamai Network Space). 59 of the WordPress sites deliver their main page from a Cloudflare address, which does not identify the origin where WordPress is actually running. Cloudflare's proxying replaces the exposed origin address with its own.
Web Servers
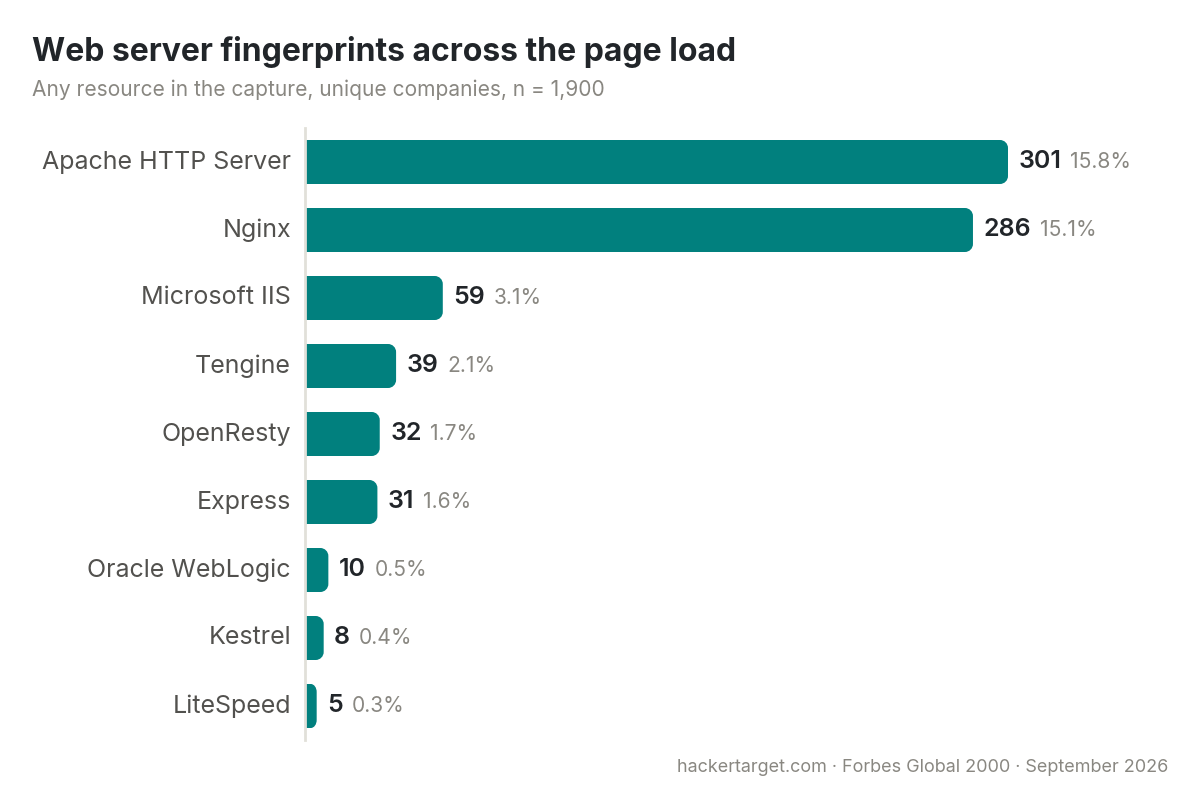
Across all the resources in a page load, Apache and Nginx remain the most prominent web server fingerprints, with Microsoft IIS a distant third. These signals can come from a service subdomain or a third party resource rather than the landing page itself.
Looking only at the Server: header of the main HTML document gives a very different, and more honest, picture. 708 companies (37%) send no Server header at all, and the largest named value is Cloudflare rather than any origin web server.
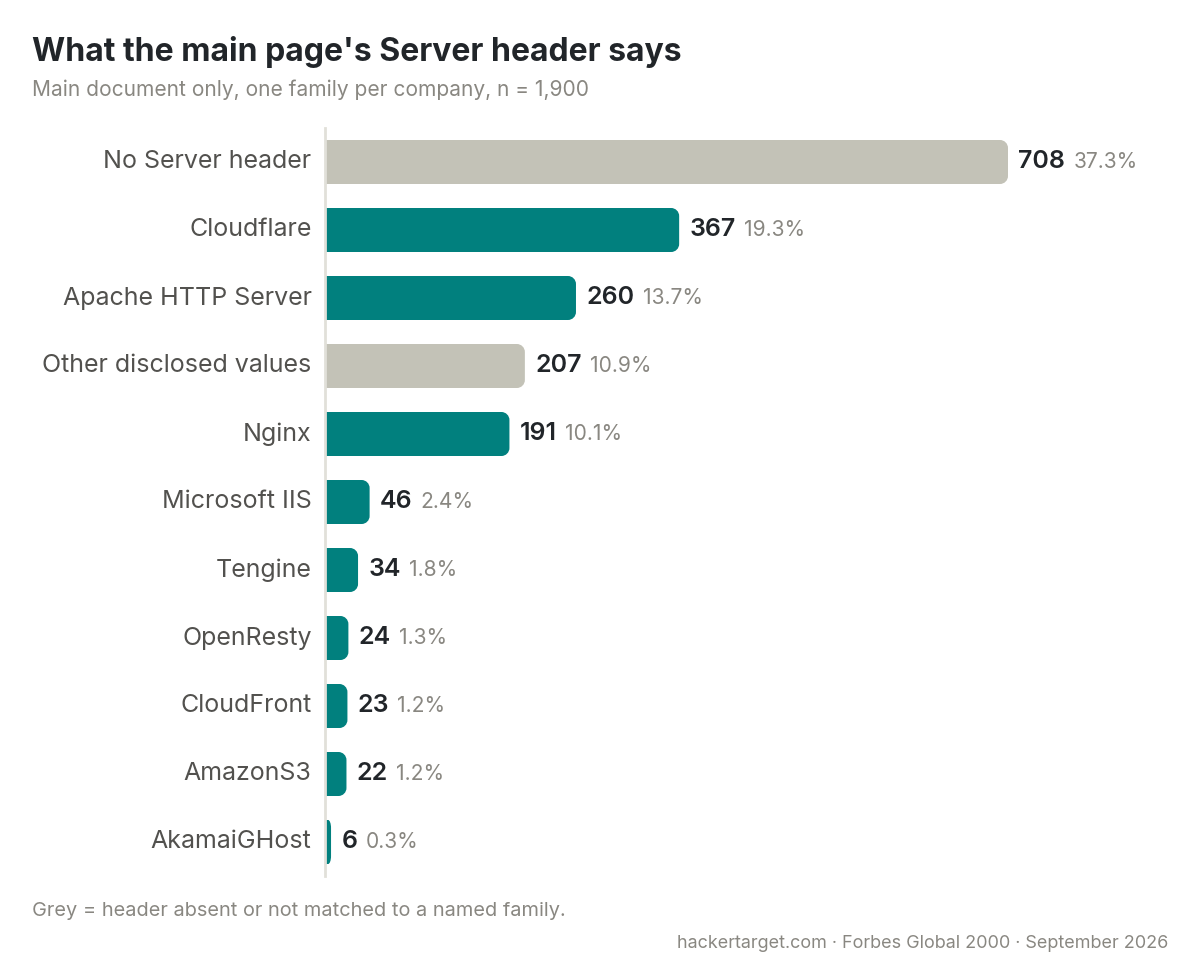
The header is a disclosure, not a verified software inventory. It can name an edge service, be deliberately generic, or be missing entirely. Apache and Nginx are still visible on hundreds of sites, but a large number reveal no origin server product through this method. Relying on these counts for origin server market share would be inaccurate.
The proportion of IIS is lower than in the Fortune 1000 study. Some of that is likely the international sample, and some is the increasing number of sites where the CDN hides the origin.
Operating Systems
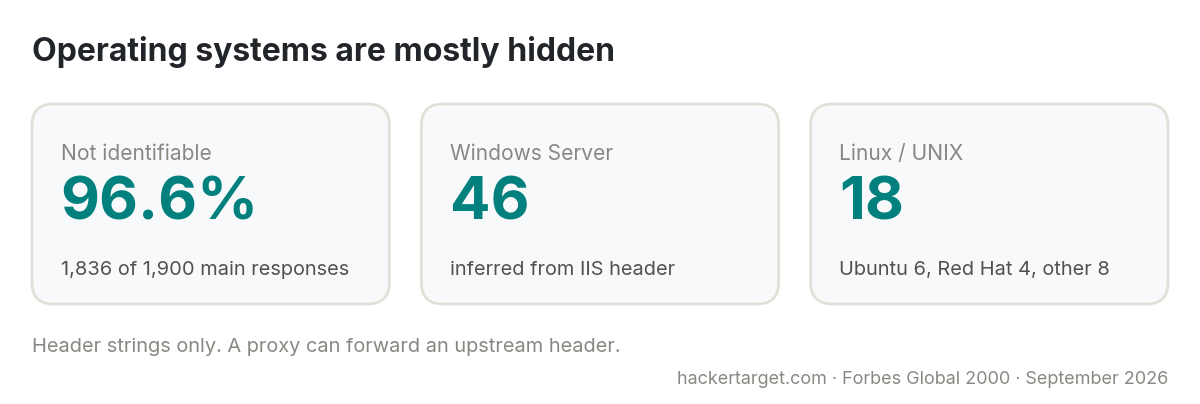
In the Fortune 1000 report we were able to extrapolate Windows Server versions from IIS version strings and found a number of end-of-life systems. That is no longer possible at any scale. 1,836 of the 1,900 main responses (96.6%) give no operating system signal. None of this proves the exact OS version on the host, since a proxy can forward an upstream header, and so there is no accurate share of Linux vs Windows analysis.
jQuery, Bootstrap and the JavaScript Stack
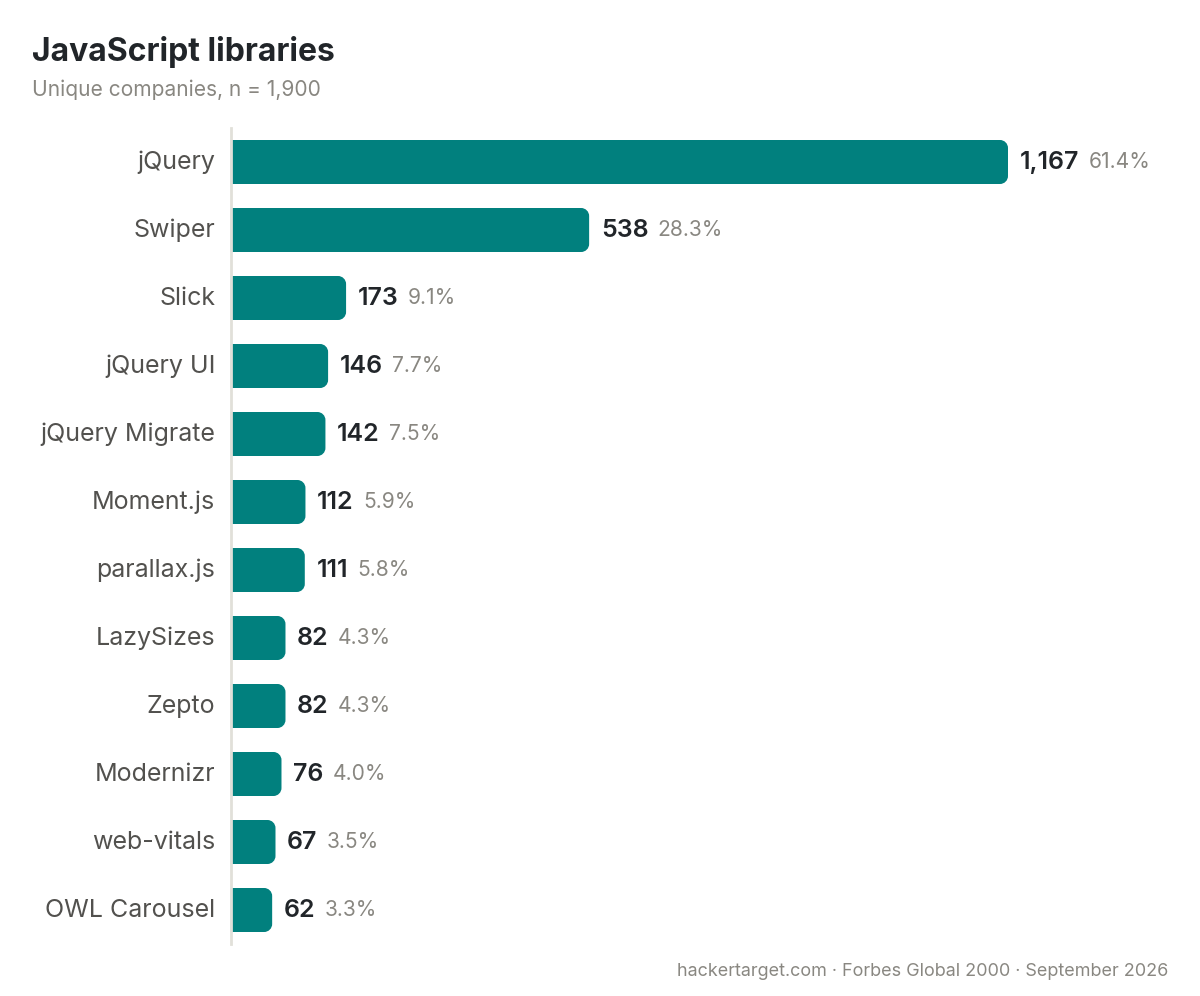
jQuery is loaded by 1,167 sites (61%), a proportion almost unchanged from the Fortune 1000 five years earlier. Swiper, Slick and OWL Carousel show how much of the enterprise homepage is still old style animations. jQuery Migrate on 142 sites is a hint of old code being carried forward.
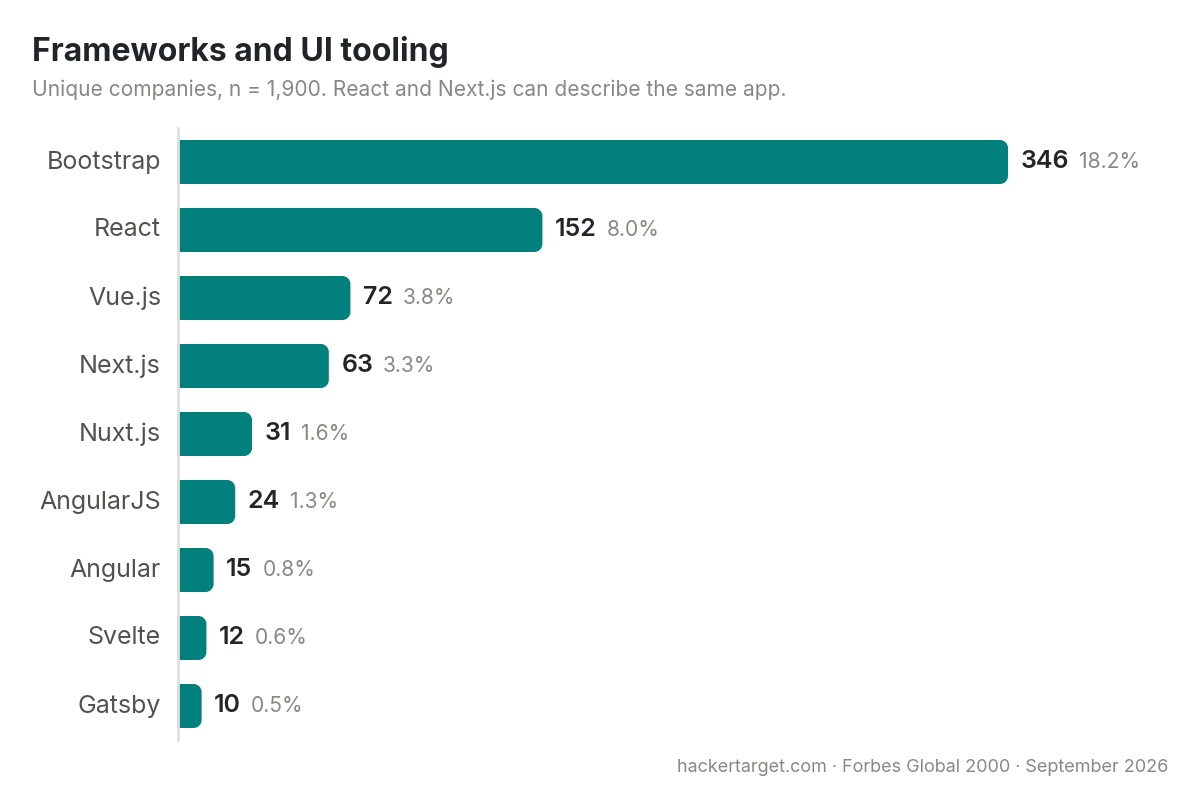
Bootstrap is still the most common UI framework at 346 sites (18%). Among the application frameworks, React leads with 152 sites, followed by Vue.js and Next.js. React and Next.js often describe the same application. These modern frameworks sit alongside jQuery rather than replacing it.
jQuery Versions
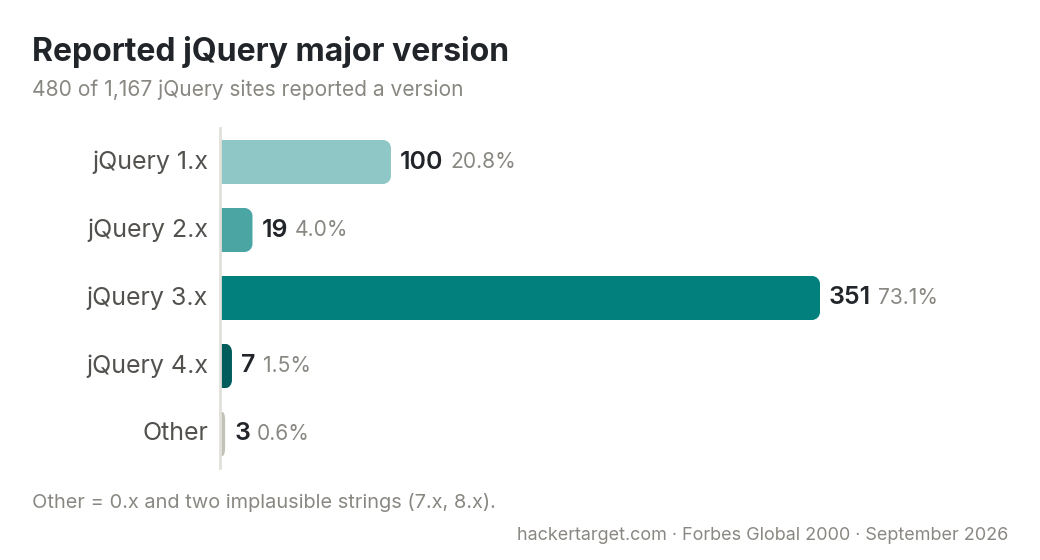
A version string is a lead for validation, not proof of a vulnerability. It does not establish whether the vulnerable functionality is reachable.
Server Side Technologies
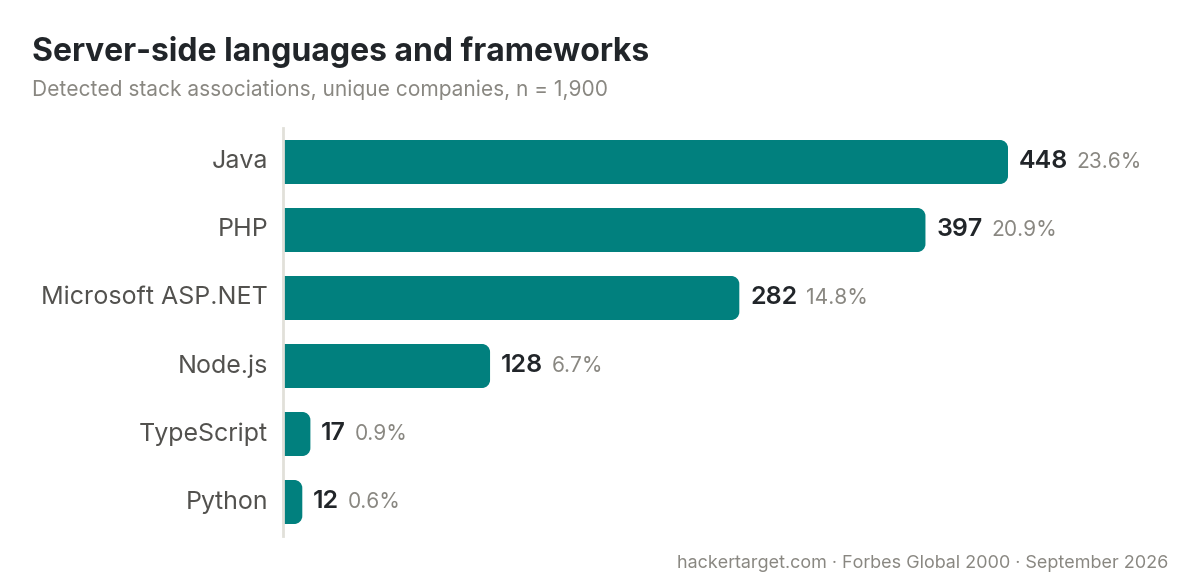
As with the Fortune 1000, Java and ASP.NET are heavily represented as to be expected on enterprise platforms and Microsoft built IT departments in large corporations. The Java figure is boosted by Adobe Experience Manager, which is a Java application. PHP tracks the WordPress and Drupal numbers, and Node.js shows up behind the Next.js and Nuxt.js deployments.
Web Front End Services (CDN)
As expected, a large number of the Forbes Global 2000 are using a global content delivery network in front of the primary web server. Rather than resolving each domain again, the IP address recorded for the main HTML document was looked up against a local ASN snapshot from 4 September 2026. This links the result to the actual endpoint IP address used during collection.
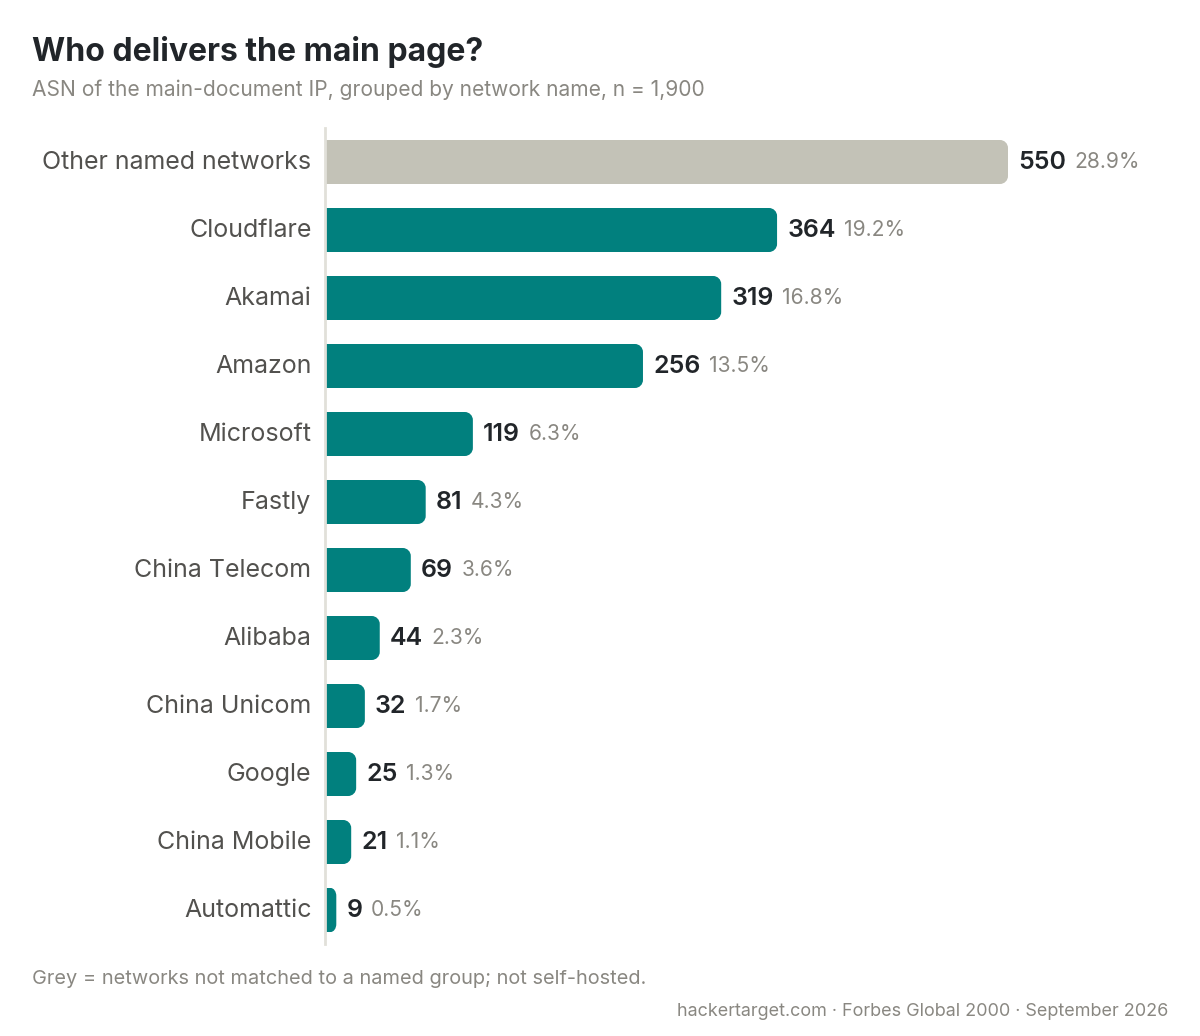
In the Fortune 1000, Akamai was well ahead of Cloudflare. Across the Forbes Global 2000 that has changed, with Cloudflare delivering the main page for 364 companies (19%) and Akamai for 319 (17%). Amazon follows at 256, covering both CloudFront and sites hosted directly in AWS, with Microsoft, Fastly and the large Chinese providers behind. The 550 companies in "other named networks" include other CDN's, security providers and corporate address space.
Leading Main-Response ASNs
The Vocus entry is a good example of why a listed ASN identifies the IP address space connected to and not always the origin. It is an Australian provider, and 85 Forbes companies are unlikely to be hosting their websites there. CDN nodes are deployed inside partner and networks, so that is what the capture saw from the Australian Starlink connection.
| ASN | Network | Companies | % |
|---|---|---|---|
| AS13335 | Cloudflare | 322 | 16.9% |
| AS16509 | Amazon (AMAZON-02) | 251 | 13.2% |
| AS16625 | Akamai Technologies | 174 | 9.2% |
| AS20940 | Akamai International | 141 | 7.4% |
| AS8075 | Microsoft | 119 | 6.3% |
| AS19551 | Incapsula (Imperva) | 103 | 5.4% |
| AS9443 | Vocus Retail, AU | 85 | 4.5% |
| AS54113 | Fastly | 81 | 4.3% |
| AS4134 | China Telecom backbone | 43 | 2.3% |
| AS209242 | Cloudflare London | 42 | 2.2% |
| AS37963 | Alibaba | 35 | 1.8% |
CDN Fingerprints
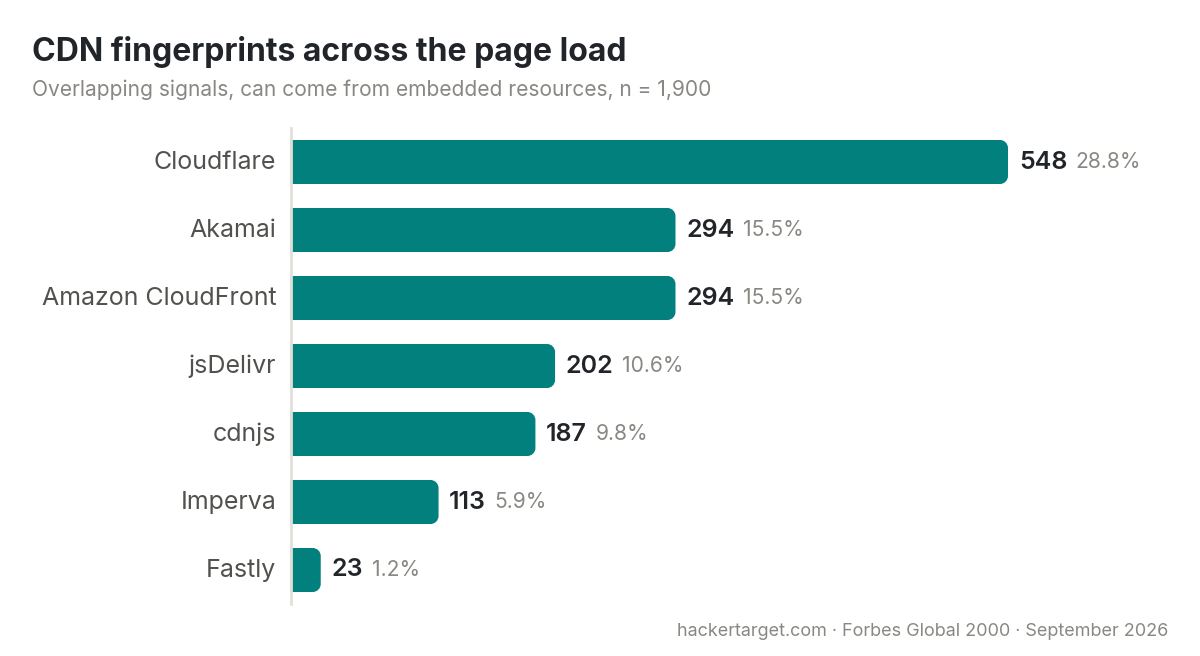
Technology fingerprints and ASN attribution answer different questions. A Cloudflare or Akamai fingerprint can appear on a page whose main document arrived over another network, usually because an embedded resource is served through the CDN.
Expanding the Attack Surface
So far we have looked at the main page. Every page load also pulls in fonts, analytics, tag managers, libraries and application services from networks the company does not operate. Counting each company once per network that appeared anywhere in its page load gives a view of these external dependencies.
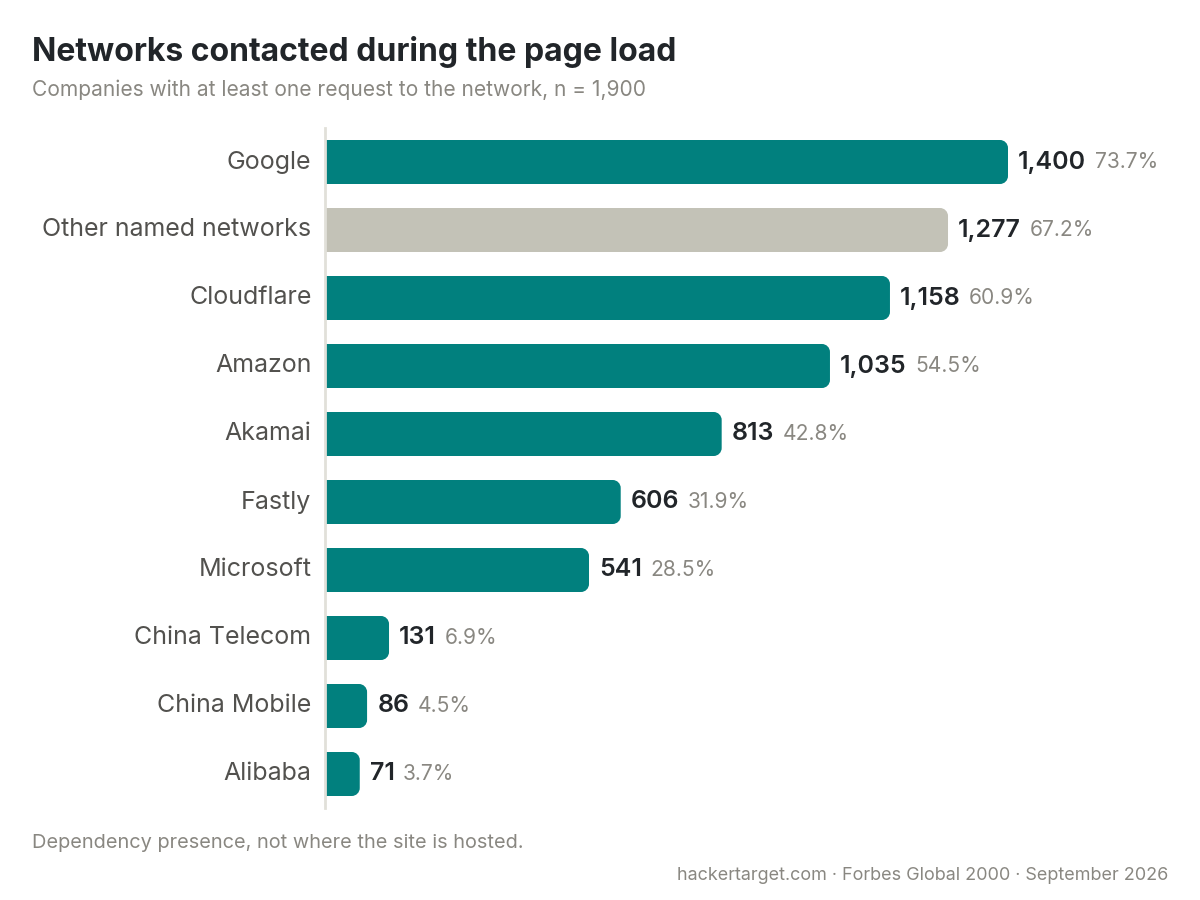
Google appears in the page load of 1,400 companies (74%), this includes fonts, analytics and tag management. Cloudflare, Amazon and Akamai each turn up on more than 800 sites. This is a measure of dependency presence, not evidence that the company hosts its primary application in those clouds, and it is not a substitute for enumerating a company's subdomains.
Proliferation of Hosted Services
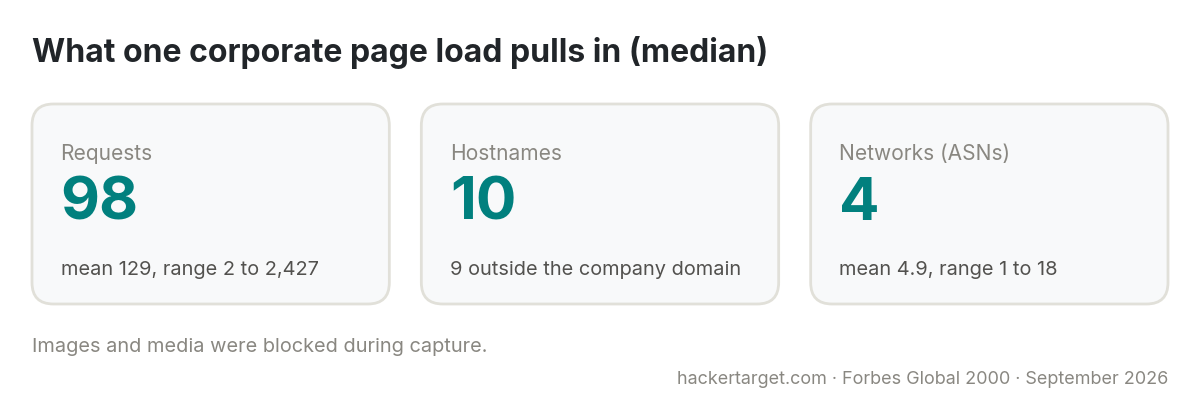
The median page made 98 requests to 10 hostnames across 4 networks. The heaviest page made 2,427 requests to 168 hostnames. The obvious finding is that a public website's delivery chain is far broader than its main host (and highly relevant in supply chain attacks). Security teams need the complete picture of the attack surface, including the third parties that can inject script into the corporate homepage.
The Smallest Site
Its capture contains just six requests, against a sample median of 98. A major company can still serve important information while maintaining a very small attack surface.
Where Are the Servers?
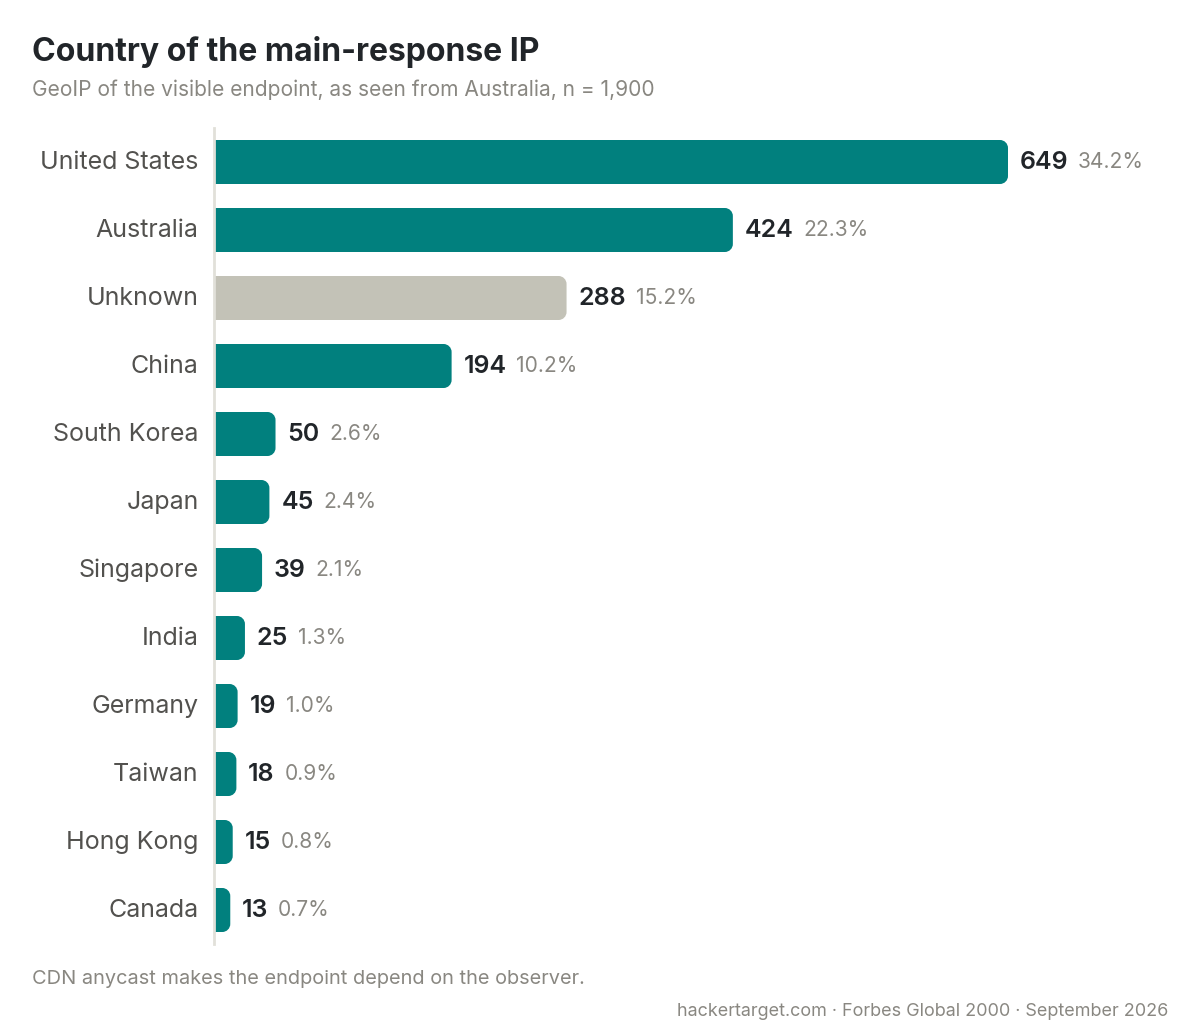
GeoIP supplies a country for 1,612 of the 1,900 main-response addresses. The United States leads as expected, followed by Australia. That is not where the Forbes companies host their origin servers, it is where the nearest CDN node happened to be for a browser on a Starlink connection in Australia. China is the other notable entry, since Chinese companies are largely served from Chinese networks that do not use the western CDNs.
Methodology
Each company's primary domain was loaded in an automated Chrome browser with the complete page load saved as a HAR file. Technology detection was performed against the captured responses, scripts and headers using the same fingerprint approach as our hosted technology detection tool.
The main page IP address was mapped to an ASN using a local ASN routing snapshot and to a country using the GeoLite2 database, both dated early September 2026. No live DNS lookups were used for attribution, so every result is tied to the connection actually made during the capture. See our ASN lookup tool for the same data.
** LLM assistance was provided during collection operations and the generation of the charts in the post
Next Level Your Technical Network Intelligence
- 13 Vulnerability Scanners
- 17 Free DNS & Network Tools
- 4+ Billion Records of DNS / IP data