Cowrie Honeypot Analysis
24 hours after installing a fresh Cowrie Honeypot on a Digtial Ocean node in Singapore. I have data.
Lets jump straight in with an "Attack Map" - Pew Pew
Our super fun attack map shows unique ASN that connected to our Cowrie Honeypot over the 24 hour period. The yellow indicates SSH connections while the red is the Telnet connections. As is the case with many of these attack maps, the tactical value from such a visualisation is often impressing the company board to get more security funding and resources. However, it does provide some value showing the clear geographical and organisational spread of attack sources against our host in only 24 hours. There is no representation of the volume of connections from each source within the animated graphic.
What is a Pew Pew Map?
A "pew pew map" is a security visualisation of cyber attacks, usually animated and highly visual. It is a trendy way to market your product, infamously having been used by Norse Corp. The company became known because while they had a highly visual attack map, it seemed to provide little value and was using what appeared to be sketchy data.
Created with Leafletjs
For anyone else wanting to develop an attack map for your NOC projector (your boss will love it). Head over to leafletjs. Combine that with the leaflet migration layer plugin and a sprinkling of Maxmind GeoIP and you are good to go.
What is this Cowrie Honeypot?
A honeypot is a system designed to be placed on a network for the purpose of having attackers to connect to it. Connections to the system are usually not legitimate and allow a network defender to detect the attacker through detailed logging. The logging can reveal not only normal connection information but also session information revealing the techniques, tactics and procedures (TTP) used by the attacker.
The Cowrie Honeypot is a system designed to capture SSH and Telnet connections. Recording the session information. These types of honeypots are often connected to the Internet to monitor the tools, scripts and hosts in use by password guessing attackers.
My message for companies that think they haven’t been attacked is: “You’re not looking hard enough”.
- James Snook

What's in the Logs?
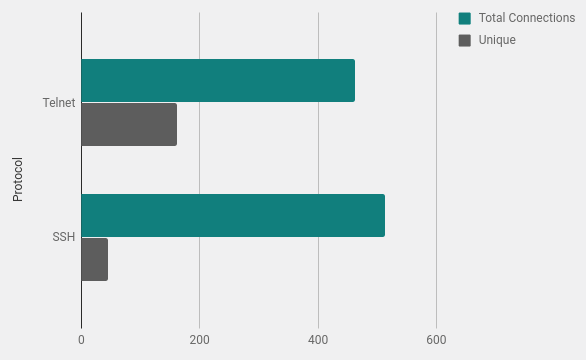
Total Number of Connections
A large number of sources attempted to connect multiple times. This is expected as the attacking scripts will have a list of credentials and try multiple combinations against a connection. The Cowrie Honeypot is configured to only accept certain username and password combinations. This is configurable within the user.db file.
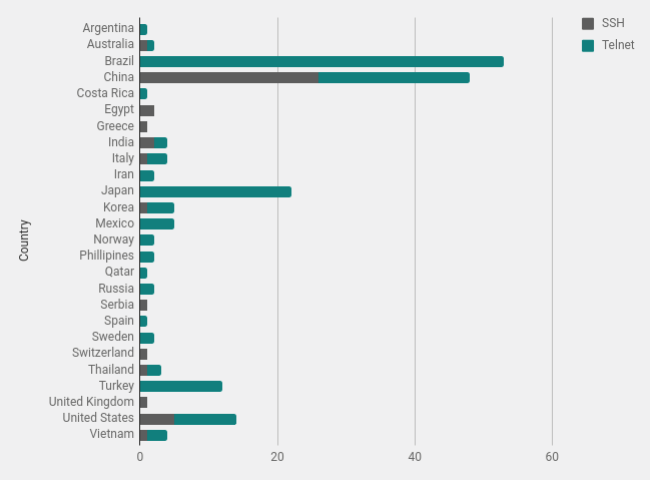
Geographic Distribution
Using Maxmind Geolocation data I plotted the number of connections from each country. Brazil and China are not surprising they are often seen as countries with a large amount of scanning noise.
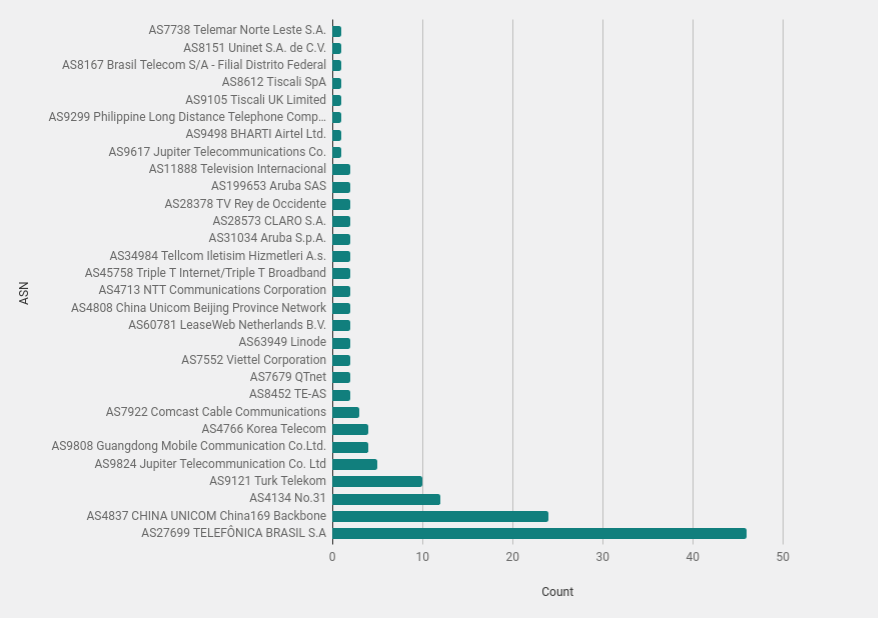
Netblock Owner
Examining the netblock (ASN) owner can reveal organisations with a high number of attacking hosts. Of course as is always the case in these types of analysis it is important to understand the attacking hosts are often compromised systems that are launching the attacks. It is possible they are attackers on home Internet but you have to assume most are not silly enough to scan from their home Internet connection.
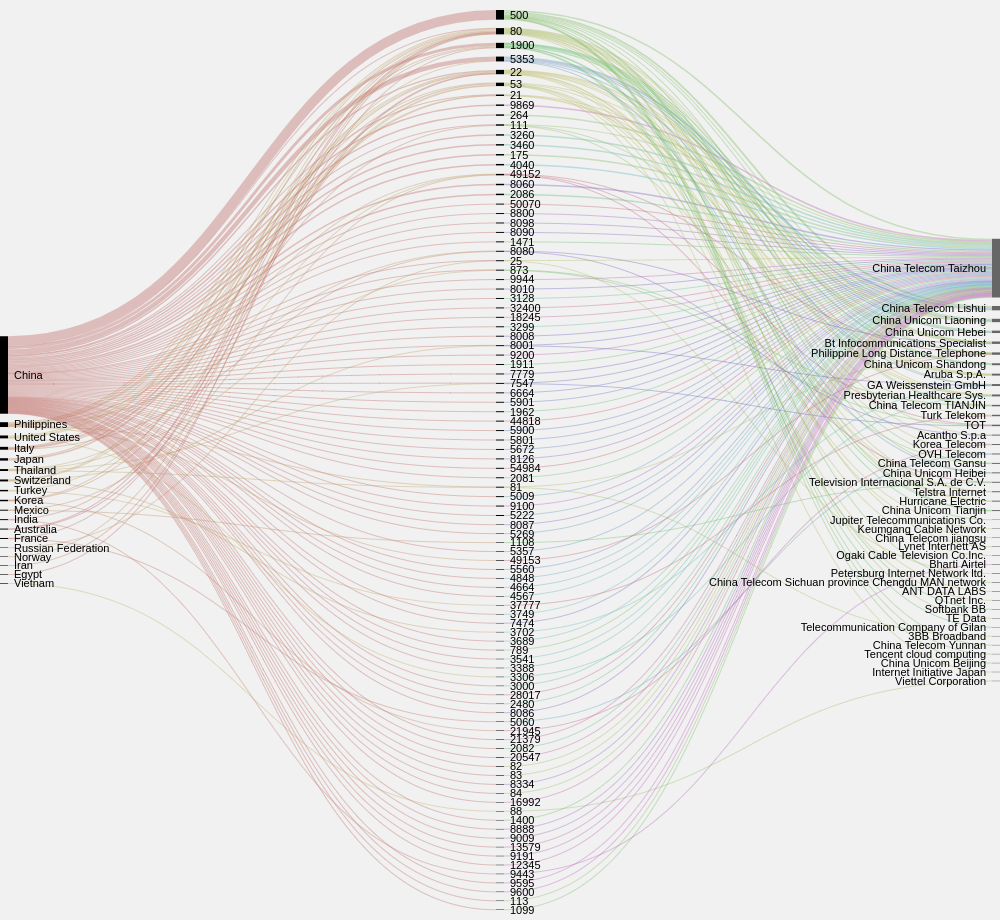
Open Ports on Attacking Systems (Data from Shodan.io)
Running the list of source IP addresses through the excellent Shodan API quickly identified systems with open ports and what those ports were. The below graphic shows the concentration of open ports against the country and organisation. This could reveal large blocks of similar systems that had been compromised, however within the small sample nothing really jumps out apart from the high number of open port 500 connections in China.
An interesting finding from the high number of systems in Brazil is that they had no open 22, 23 or other ports as recorded by Censys and Shodan. They also all appeared to be consumer Internet connections.
Bot or Not? Data says maybe Not.
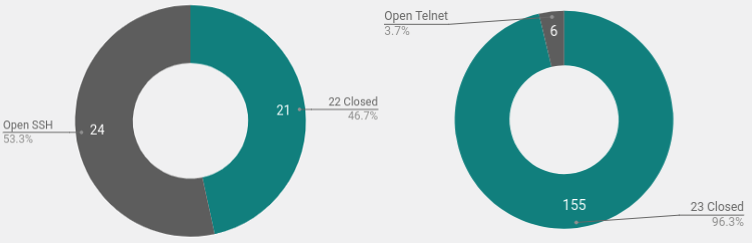
Checking the Censys data sets for port 22 and port 23 from the same day that the logs were collected revealed something surprising. I was under the assumption that the majority of these scans and password attacks were coming from self replicating scripts (bots). The script spreads by finding open ports and guessing passwords, once it gets a shell it copies itself over and continues to spread using the same method.
However as can see here, only a few of the unique hosts scanning for telnet had port 23 open to the Internet. This indicates that the systems are either compromised using another method or they are attackers running the scripts manually.
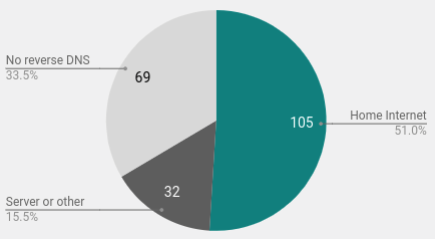
Home Internet Connections
Another interesting finding was the number of home Internet connections that were in the sample. By reviewing the reverse DNS entries of the hosts that connected to the honeypot I was able to identify 105 home Internet connections. This is due to the fact that many home connections have dsl, home, cable, fiber and so in the reverse DNS name.
Run Your Own Cowrie Honeypot
Recently I did a quick introduction to install Cowrie Honeypot on your own system. As mentioned above our analysis was performed using a Digital Ocean VPS based out of Singapore. For the 24 hours of the analysis the cost for this was literally a few cents and the time to build it (30 minutes).
Rather than running Cowrie on the Internet and catching all the noise. You might find more value running it internally within your organisation. If the ports get hit, you can simply trigger an alert. It is either an attacker in your network, a curious employee or a vulnerability scan.
Wrapping Up
After reviewing the connections and session logs of attackers to the system over only 24 hours it is clear that there is no concentration of attacks based on Organisation, Country or even operating system.
The wide spread of attack sources reveals that the scanning noise is constant and not identifiable to any particular source. Anyone running systems connected to the Internet needs to ensure those systems have multiple layers of security controls. A common and effective solution for SSH is moving the attacked service to a random high port. This does not dispel the need for strong password security and monitoring but it ensures that your monitoring is not hammered by the constant scanning. Connections to your high port service are more likely to be targeted and attacks that you might be interested in investigating.
Often times open telnet ports are on routers, or other devices that cannot be easily moved to a high port. Understanding your open ports across the entire organisations attack surface is the only way to ensure that these services are protected by a firewall or turned off altogether. Telnet should not be used if at all possible, it is not encrypted - if it must be used, block it, monitor it and use strong passwords.
I will do a follow up article with a larger sample of logs and an examination of the sessions from logged in attackers. What are you doing with that shell? What does that binary do? So jump on the mailing list below or follow us on twitter to ensure you get notified when this is released.