Generate an Nmap Dashboard using Grafana and Docker to get a clear overview of the network and open services.
This weekend's project uses a similar technique to the previous Zeek Dashboard to build an easy to deploy dashboard solution for Nmap results.
Building small deployments like this gives the operator a greater understanding of how the tools work, developing skills that can be used to implement custom solutions for your specific use cases.
Explore the Nmap Dashboard, and dig deeper into your network analysis.
Using Grafana to View Nmap Results
1. Introduction to Nmap Visualisation
2. Generating the SQLite Data Source
3. Grafana Docker Container
4. Accessing Grafana and Dashboard
5. Conclusion
Introduction to Nmap Visualisation
Nmap is a well known port scanner to find open network services. Not only finding open ports Nmap is able to identify services, operating system and much more. These insights allow you to develop a detailed picture of the network or system. When viewing a single host the standard Nmap output options are sufficient but when you are analysing multiple hosts and perhaps even the same host over time it becomes more difficult.
By parsing the Nmap XML and populating an SQLite database we can use a Grafana Dashboard to analyse the data.
A primary aim of these mini projects is to demonstrate how combining open source tools and building simple data processing pipelines we can create elegant solutions with real world use cases. At the same time the analyst or administrator will build valuable skills integrating the tools.
Generating the SQLite Data Source
First up we need some Nmap results in XML format. You can run any nmap command with -oA myoutput to generate XML output. This generates output in all (A) forms including XML.
user@ubuntu:~$ sudo nmap -sV -F --script=http-title,ssl-cert -oA myoutput 10.0.0.0/24
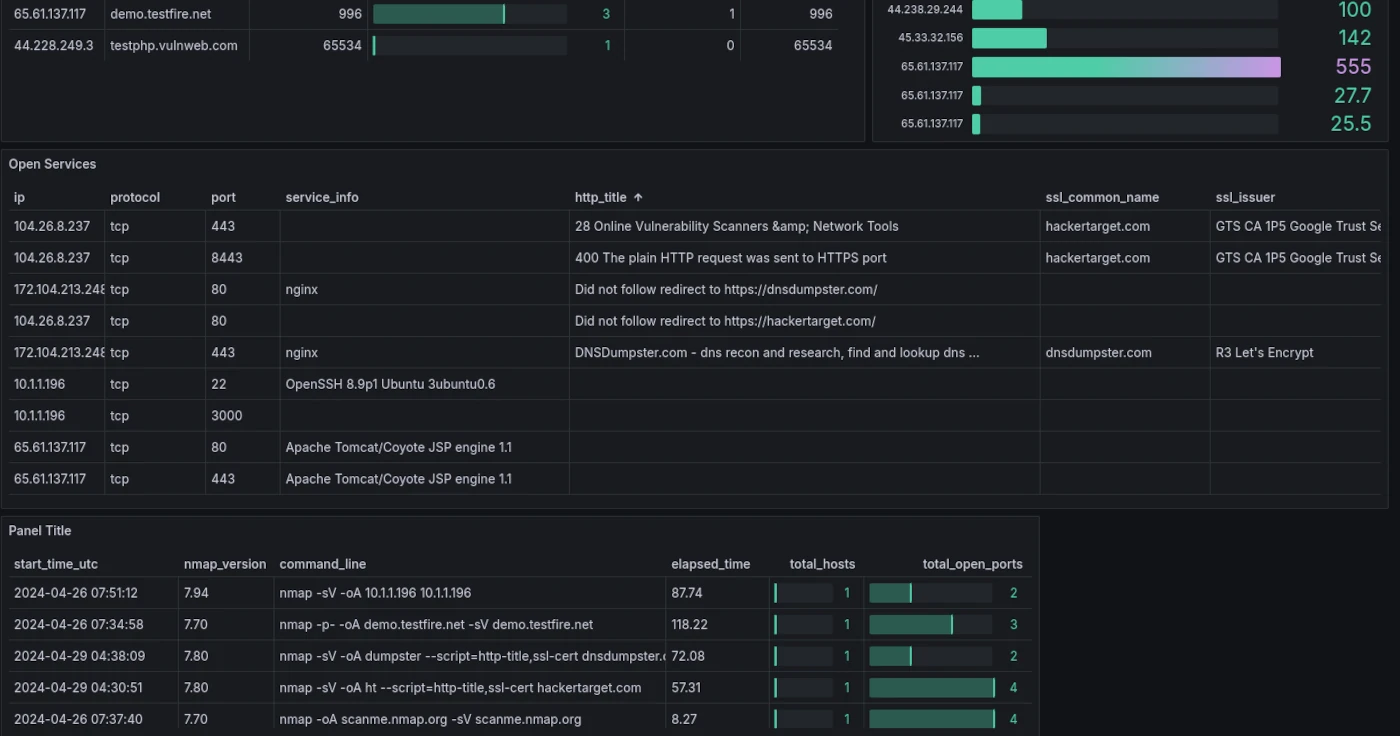
This command will create a file myoutput.xml. The two scripts we are using here (http-title / ssl-cert) are non-intrusive but can provide valuable insight into the service. The script and dashboard include queries to parse the results from these two scripts. It would be easy enough to extend the python script and dashboard queries to customise for a specific use case with other scripts such as Microsoft SMB or other protocols.
git clone https://github.com/hackertarget/nmap-did-what.git
To parse the myoutput.xml file and create the SQLite DB we will run the included python script.
user@ubuntu:~$ cp myoutput.xml nmap-did-what/data/
user@ubuntu:~$ cd nmap-did-what/data/
user@ubuntu:~/nmap-did-what/data$ python3 nmap-to-sqlite.py myoutput.xml
user@ubuntu:~/nmap-did-what/data$ ls
nmap_results.db myoutput.xml
The sequence of commands above generates the nmap_results.db from the XML. Running the script again on other Nmap XML will append to the database. So simply run it against any results you wish to analyse.
Note the nmap_results.db listed above, this is the sqlite database. The Grafana Dashboard is pre-configured with this DB as a data source and located in /data/ in the container.
Grafana and Docker Compose
Now that we have our SQLite datasource with the Nmap data. We can start up the Grafana docker container and start our analysis.
docker-compose config builds Grafana with a custom Nmap Dashboard and the SQLite data source installed.user@ubuntu:~$ cd nmap-did-what/grafana-docker/ user@ubuntu:~/nmap-did-what/grafana-docker$ sudo docker-compose up -d user@ubuntu:~/nmap-did-what/grafana-docker$ sudo docker ps -a CONTAINER ID IMAGE COMMAND CREATED STATUS PORTS NAMES daba724a6548 grafana/grafana "/run.sh" 1 hours ago Up 1 hours 0.0.0.0:3000->3000/tcp, :::3000->3000/tcp grafana
If you wish to customise the build, simply review the docker-compose.yml file. The dashboards and data sources directories contain the configuration information for the creation of the SQLite data source and the Nmap Dashboard within the newly created Grafana container. These files could be extend to build multiple dashboards or use other data sources.
Accessing Grafana and Nmap Dashboard
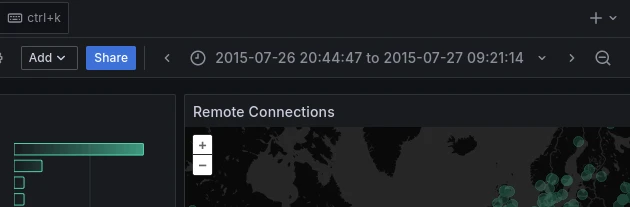
Grafana should now be running on its default port of 3000, so from your browser access https://127.0.0.1:3000 (or whichever IP you are running on).
The initial login will be admin/admin. This will need to be changed on first login. The authentication information and any changes to the Grafana configuration will be saved in the Grafana storage that was created with the docker-compose.yml. The grafana-storage directory contains the running Grafana information. You can stop and start the docker container with changes being saved. If you remove this data the login credentials, and any changes to the Grafana configuration from the web console will be removed.
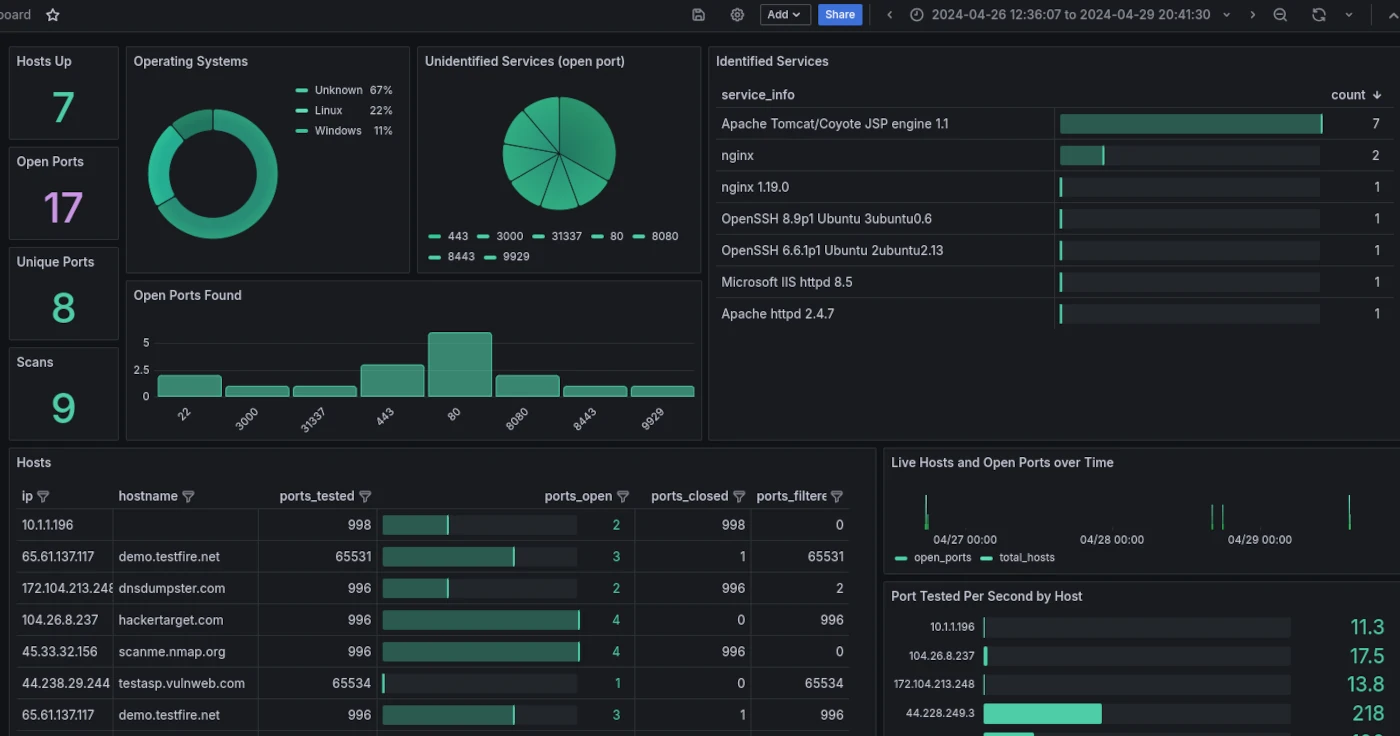
After accessing the Dashboard, the first thing you may need to change to see the data will be date range. Nmap data will be accessible and able to be filtered based on the date / time.
Conclusion
In this post, we explored the powerful combination of Nmap and Grafana for network monitoring and visualization. By leveraging Nmap's network scanning and Grafana's intuitive dashboard creation, we were able to get a detailed picture of our network, identify services and operating systems.