pcap.
This weekend's project highlights the power of integrating different open source tools. The two docker containers can be spun up immediately to get immediate insight into a network pcap; however the real advantage of this mini project is as a starting point to build more a custom solution and learn more about these excellent tools.
Explore the Grafana dashboard, and dig deeper into Zeek analysis to develop custom insights into your network environment. Go from a boring pcap to nice looking visuals in minutes.
Deploy Grafana to Analyze Zeek Logs
1. Introduction to Zeek Visualisation
2. Generating the SQLite Data Source
3. Grafana Docker Container
4. Accessing Grafana and Dashboard
5. Conclusion
Rather than install Grafana from scratch, this guided project covers using docker to deploy a usable system in as little as a few minutes.
The docker-compose config builds Grafana with a custom Zeek Dashboard and the SQLite data source installed.
Introduction to Zeek Visualisation
Zeek is a powerful network analysis tool and is commonly used with Elasticsearch and Kibana to build dashboards that visualise the data. Rather than go down that rabbit hole we have opted to use a lightweight solution using Grafana.
In the first part of this series we built a custom docker container for Zeek, to process the pcap and output the zeek log files. In the zeek container is a custom python script that will convert these log files to a sqlite3 database. Using a sqlite3 data source is a simple way to access the data within Grafana. There are many other ways this could be implemented, but this process is simple and portable.
A primary aim of this mini project is to demonstrate how combining open source tools and creating simple data processing pipelines we can create elegant solutions, while gaining a deeper understanding of how the tools work.
Generating the SQLite Data Source
In the previous part of this series we generated the zeek docker container and ran zeek against our pcap. This resulted in the zeek log files being generated into the /data/ directory.
From bash in the Zeek container we can run the custom script to convert the zeek log files to an sqlite3 database.
root@42f7fd693ca0:/data# zeek-to-sqlite.py
root@42f7fd693ca0:/data# ls
2015-07-28_mixed.pcap  conn.log  files.log        known_services.log  ocsp.log           software.log  telemetry.log  x509.log
analyzer.log           dns.log   http.log         loaded_scripts.log  packet_filter.log  ssl.log       websocket.log  zeek_logs.db
capture_loss.log       dpd.log   known_hosts.log  notice.log          pe.log             stats.log     weird.log
root@42f7fd693ca0:/data#
Pay attention to the zeek_logs.db, this is the sqlite database. Viewing the db you will notice the logs from zeek are now tables within the database. Note that the column names have changed from any '.' to '_'. This is relevant when creating sqlite queries in Grafana.
Grafana and Docker Compose
Now that we have our SQLite datasource with the Zeek data. We can start up the Grafana docker container and start our analysis.
:~$ cd pcap-did-what/grafana-custom/
:~/pcap-did-what$ sudo docker-compose up -d
:~/pcap-did-what$ sudo docker ps -a
CONTAINER ID   IMAGE             COMMAND       CREATED         STATUS                      PORTS                                       NAMES
daba724a6548   grafana/grafana   "/run.sh"     1 hours ago    Up 1 hours                 0.0.0.0:3000->3000/tcp, :::3000->3000/tcp   grafana
If you wish to customise the build simply review the docker-compose.yml file. The dashboards and data sources directories contain the configuration information for the creation of the SQLite data source and the Zeek Dashboard within the newly created Grafana container. These files could be extend to build multiple dashboards or use other data sources.
Accessing Grafana and Zeek Dashboard
Grafana should now be running on its default port of 3000, so from your browser access https://127.0.0.1:3000 (or whichever IP you are running on).
The initial login will be admin/admin, and this will need to be changed on first login. The authentication information and any changes to the Grafana configuration will be saved in the Grafana storage that was created with the docker-compose.yml. This means stopping and starting the container will not affect these changes. To restart with a clean Grafana remove the ./grafana-storage directory.
- ./grafana-storage:/var/lib/grafana
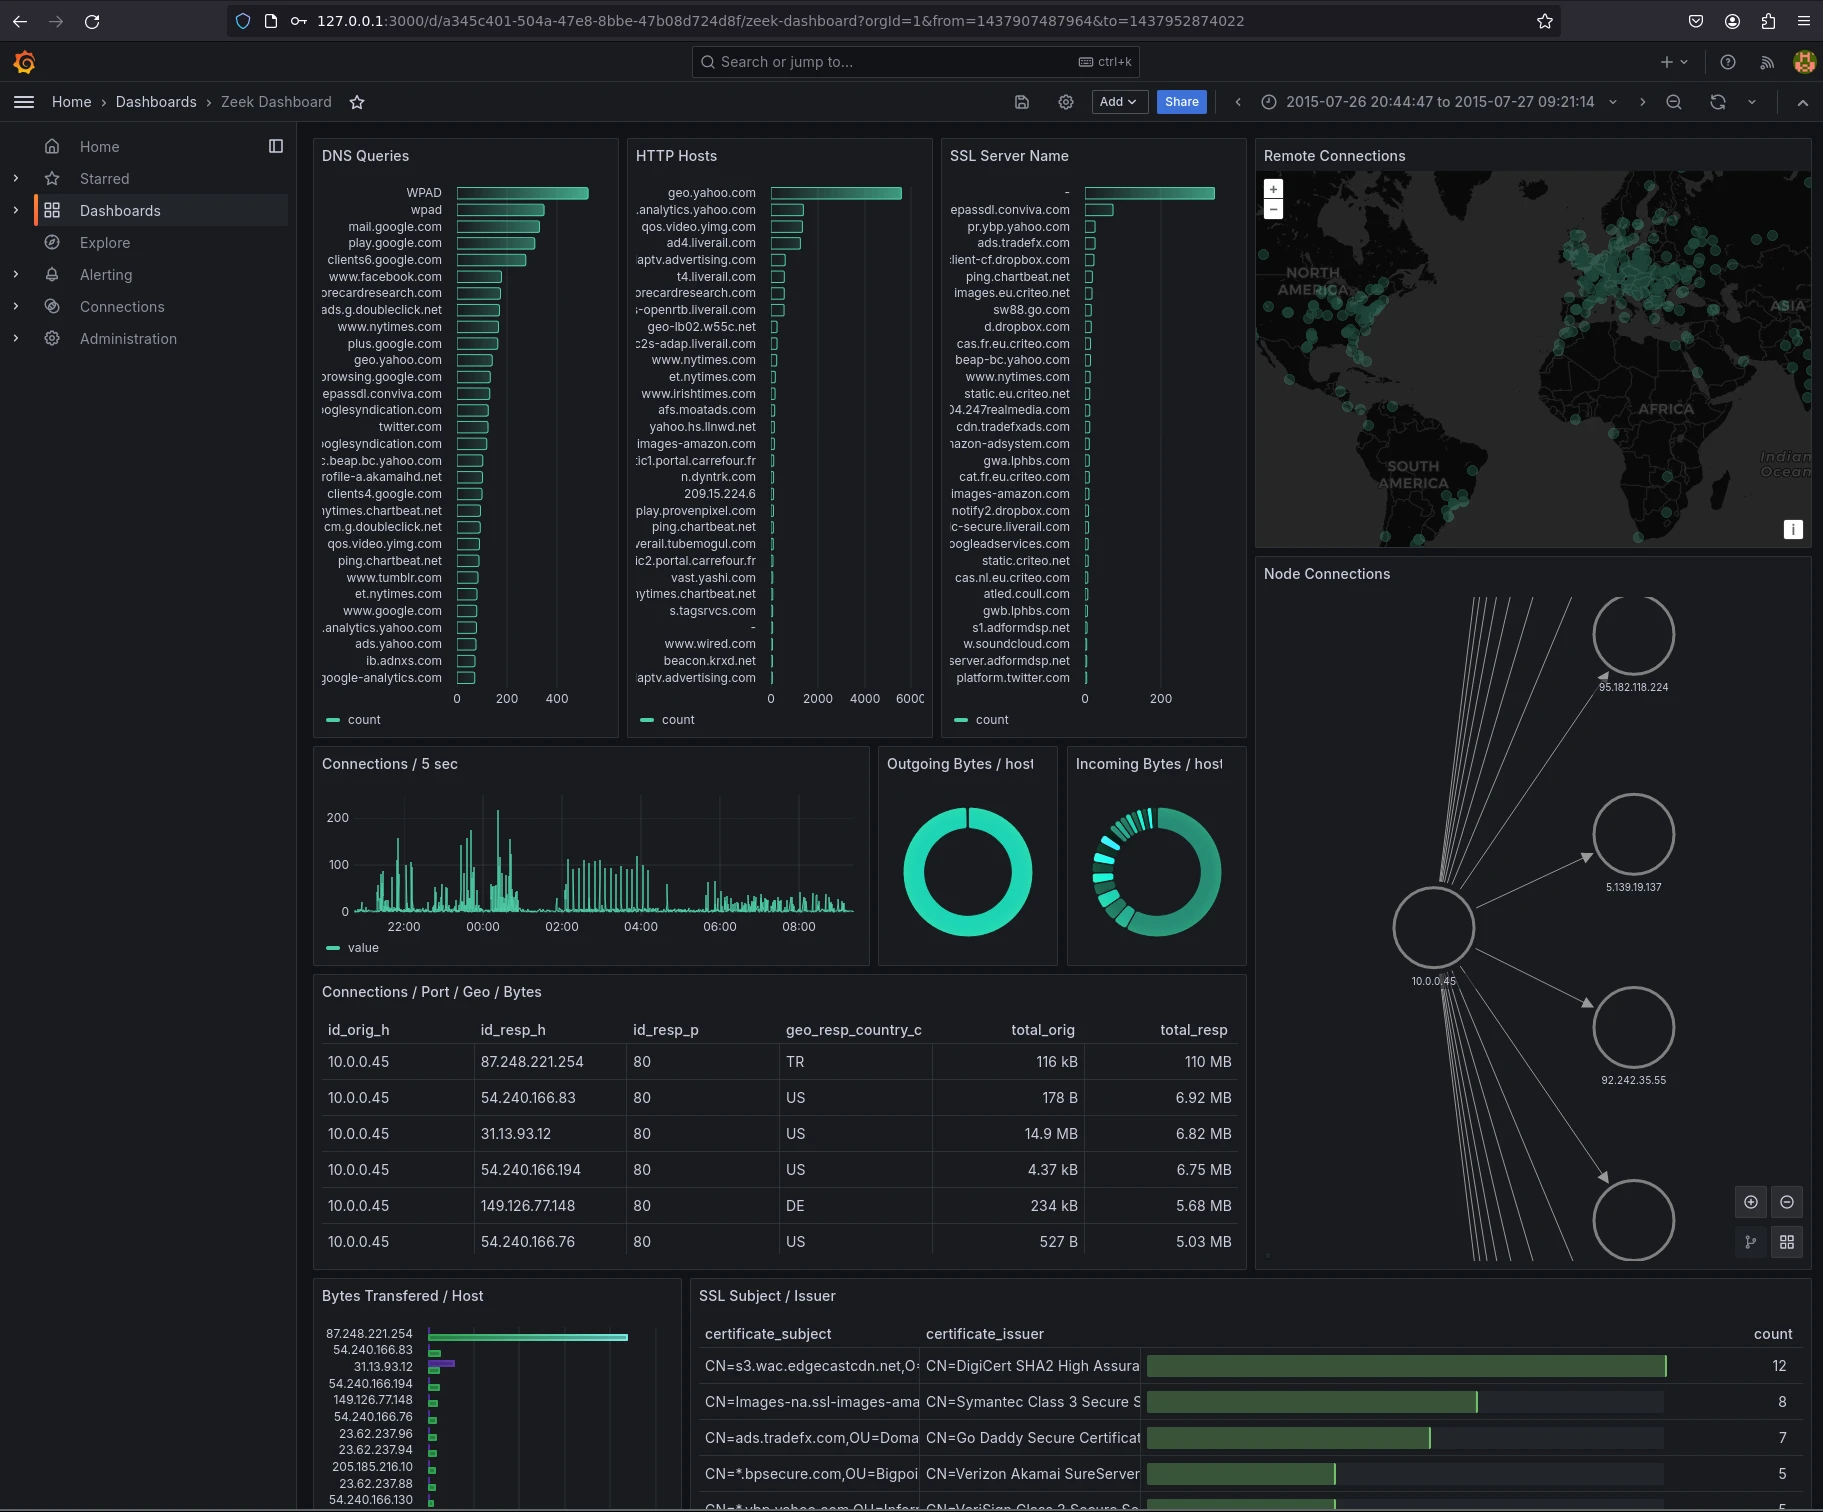
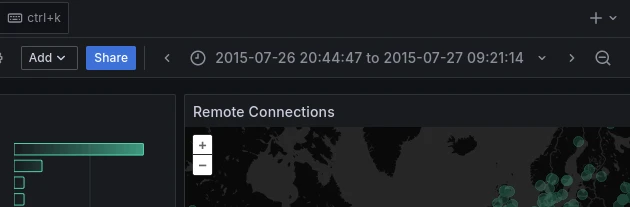
After accessing the Dashboard, the first thing you may need to change to see the data will be date range. If you are using historical network pcaps then the date range on the dashboard will need to be adjusted to catch the relevant time frame.
Conclusion
In this post, we explored the powerful combination of Zeek and Grafana for network monitoring and visualization. By leveraging Zeek's extensive network analysis capabilities and Grafana's intuitive dashboard creation, we were able to gain valuable insights into our network traffic and identify potential security threats.
As you become more familiar with Zeek and Grafana, you'll discover more opportunities depending on your environment and use case for customization. This knowledge will enable you to fine-tune your Zeek analysis, create more sophisticated Grafana dashboards, and proactively detect and respond to threats.